Powered by Stats, Backed by Logic
Powered by Stats, Backed by Logic
Decoding Charts
It’s about interpreting the underlying market structure and recognizing the behaviour of price through volume, momentum, and time.
The purpose of posting blogs under the “Decoding charts” category is to help traders understand when to take the right decision based on the right combination of technical, fundamental, and quantitative analysis.
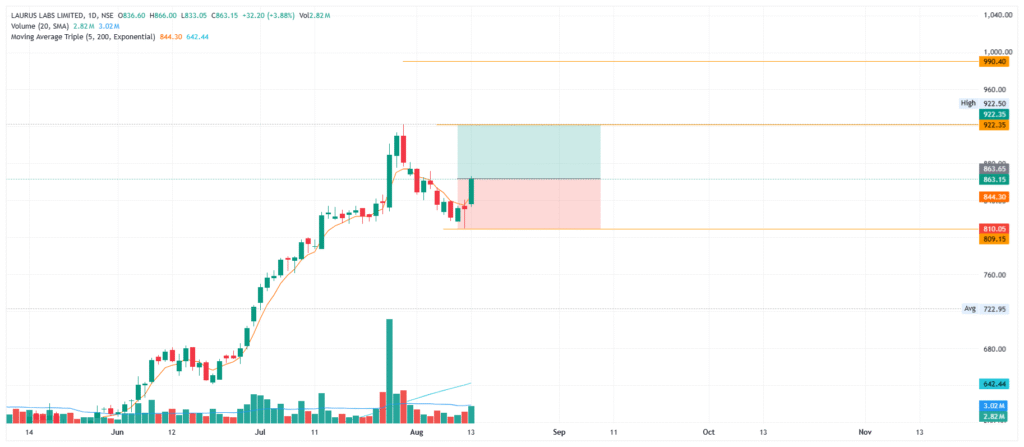
Laurus Labs Ltd
Nifty Smallcap 250
Basic Industry: Pharmaceuticals
Quarterly Revenue and Quarterly Net Profit are Positive
Institutional Holdings Increased
Entry around: 863
Target: 920
Probability check on Nifty 50
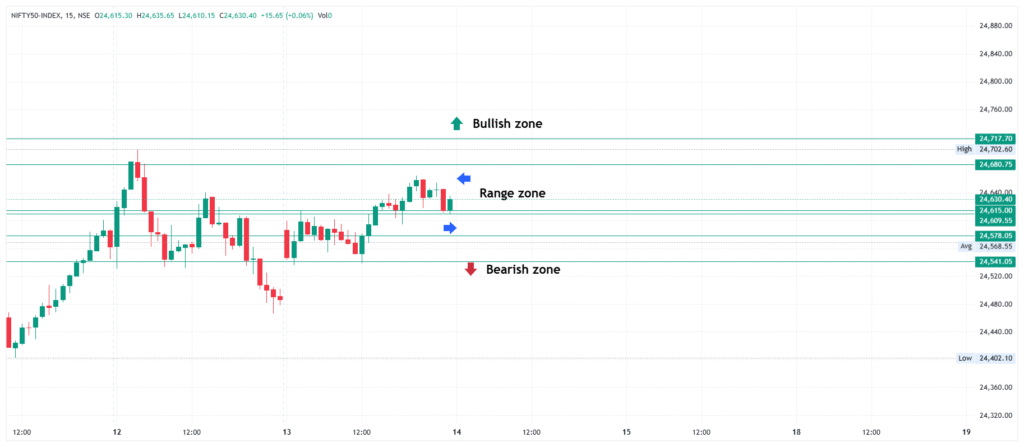
The Market is uncertain. The market is not controlled by any individual investor.
The chart should help you analyse the forthcoming probable momentum in stocks. These stocks may reach their target within a week or a few weeks.
Please exit 80% of your position in the first target and balance in the next target. Before trading with real money, consider practicing paper trading. We hope our blog will help you kick-start paper trading with a clear understanding of the importance of placing stop losses and effective position sizing.
Whether you are a beginner or a seasoned trader, StatStock is here to support your growth, enhance your strategy, and help you build wealth — one calculated trade at a time.